
Data and research
Digital marketing statistics in Brazil in 2026
How many Brazilians are online, how many companies have a website, who owns search and how much goes into ads. 150 data points from 20 surveys and reports, each with its source, for you to check and cite.

The numbers that matter most
- 168.7 million Brazilians use the internet, and 98.7% of them go online on a mobile phone (IBGE).
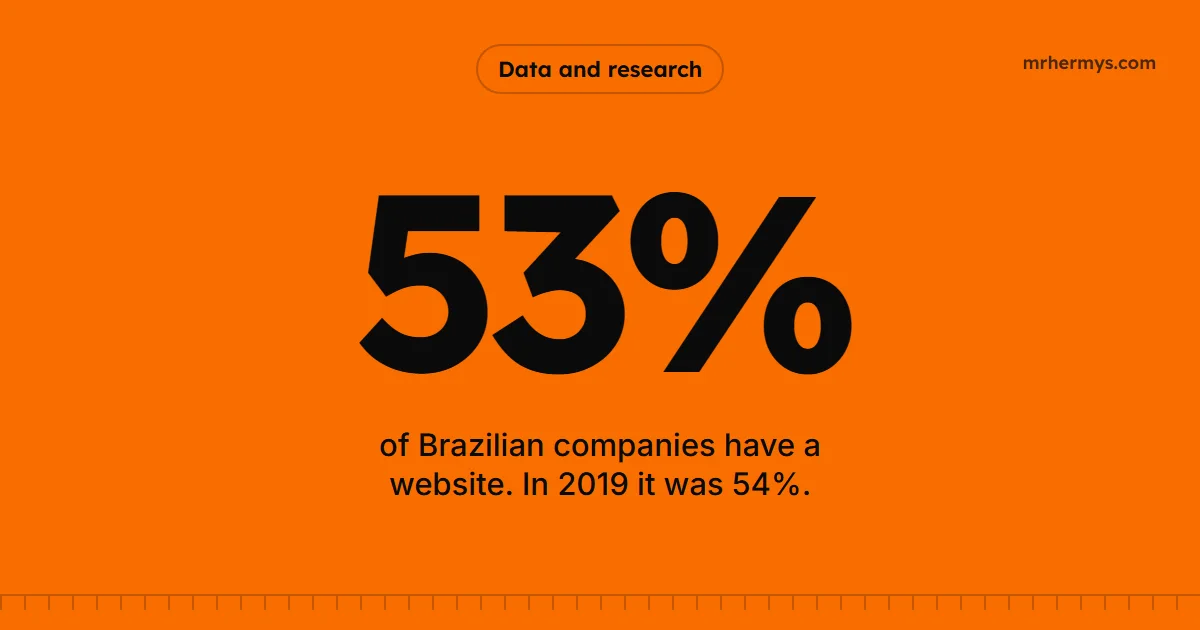
- Only 53% of companies with more than ten employed people have a website, the same level as in 2019 (Cetic.br).
- 68% of companies sold online in 2025. Among them, 79% sold through messaging apps such as WhatsApp, and 32% through their own website (Cetic.br).
- The first Google result gets 27.6% of the clicks (Backlinko). When the search shows an AI summary, the click rate of the first position is 58% lower (Ahrefs).
- Brazilian e-commerce made R$235.5 billion in revenue in 2025, with 94.2 million shoppers (Abiacom).
- 38% of small businesses that sell online do not invest in paid media (Sebrae and Fórum E-Commerce Brasil).
- 73% of marketing teams with a defined target missed it in 2025 (RD Station).
Reading this from outside Brazil? Three things help. Amounts are in Brazilian reais (R$) and were not converted. Brazilian surveys split households into income classes from A (highest) to E (lowest). And two local habits show up all over the data: WhatsApp is a sales channel, not only a messaging app, and Pix, the instant payment system run by the Central Bank of Brazil, sits next to the credit card at checkout.
Each topic below brings the highlights, a chart and the full table, which opens with one click. The button next to each row copies the data point with its source.
Internet in Brazil: how many people are online
In 2025, Brazil went past 90% of people connected for the first time. In practice, almost every potential customer in the country is on the internet, and is there on a mobile phone.
Table: Internet use in Brazil (people aged 10 or older) 6 data points
| Data point | Value | Comparison |
|---|---|---|
| People who use the internet | 168.7 million | 90.5% of the population aged 10 or older |
| Share of internet users in 2024 | 89.2% | it was 66% in 2016 |
| People who do not use the internet | 17.7 million | 9.5% of the population aged 10 or older |
| Internet users in urban areas | 91.5% | 83% in rural areas |
| Internet users among people aged 60 or older | 74.5% | more than 96% between ages 20 and 39 |
| People with a mobile phone for personal use | 167.4 million | about 90% of the population aged 10 or older |
Source: IBGE, PNAD Contínua TIC 2025, released on July 2, 2026, as reported by Teletime (in Portuguese).
Source: IBGE, PNAD Contínua TIC 2025, as reported by Teletime (in Portuguese).
Access by household and by income class
Table: Internet in Brazilian households 5 data points
| Data point | Value | Comparison |
|---|---|---|
| Households with internet access | 86% | it was 51% in 2015 |
| Class D and E households with internet access | 73% | it was 15% in 2015 |
| Class C households with internet access | 86% | 99% in class A and 95% in class B |
| Class D and E users who go online only on a mobile phone | 87% | |
| Brazilians who already use generative artificial intelligence | 32% |
Source: Cetic.br and NIC.br, TIC Domicílios 2025, as reported by Movimento Econômico (in Portuguese).
Why do the totals change from one survey to another? IBGE counts 168.7 million users among people aged 10 or older. TIC Domicílios estimates 157 million (163 million when it adds people who use the network only through apps). DataReportal reports 185 million because it considers the whole population and a different methodology. When you cite a number, always state the source and the group it refers to.
Companies in Brazil: the size of the market
Almost every company in the country is small. They are the ones that hire the most, and the ones that most need to be found by people looking for what they sell.
Table: Small businesses in the Brazilian economy 4 data points
| Data point | Value | Comparison |
|---|---|---|
| Active small businesses in Brazil | 24 million | 95% of all active companies |
| Share of micro and small companies in GDP | 26.5% | |
| Jobs created by small businesses in 2025 | 80% | of all jobs created in the year |
| Wages paid by small businesses each month | R$51 billion | R$40 of every R$100 paid in wages |
Source: Agência Sebrae de Notícias (in Portuguese), June 2026.
Table: Active companies by size and sector (end of 2024) 3 data points
| Data point | Value | Comparison |
|---|---|---|
| Companies in operation in Brazil | more than 22 million | 93.4% are micro or small companies |
| Active companies in the services sector | 52.5% | retail and trade: 29.6% |
| Average time to open a company | 18 hours | 16 hours for an individual microentrepreneur (MEI) |
Source: Mapa de Empresas, Federal Government of Brazil, bulletin for the last four months of 2024, as published by Fenacon (in Portuguese).
Table: Registered .br domains 1 data point
| Data point | Value | Comparison |
|---|---|---|
| Registered .br domains | 5,977,003 | 92.4% are .com.br |
Source: Registro.br statistics panel, as of September 27, 2026. The total changes every day.
Digital presence of companies: website, social media and online sales
This is the number that stands out most in the whole set: the share of companies with a website has not moved in six years. Many rely only on social media and WhatsApp, channels the company does not own. A professional website is still the only address that really belongs to the business.
Table: Online presence of Brazilian companies (more than ten employed people) 7 data points
| Data point | Value | Comparison |
|---|---|---|
| Companies that have a website | 53% | it was 54% in 2019 |
| Companies with a profile or account on WhatsApp or Telegram | 79% | it was 74% in 2024 |
| Large companies with a LinkedIn profile | 78% | it was 70% in 2024 |
| Companies that sold online in 2025 | 68% | 61% in 2024 and 70% in 2023 |
| Companies connected by fiber optics | 93% | 92% in 2024 |
| Companies with a connection above 500 Mbps | 35% | it was 21% in 2023 |
| Companies with a digital security policy | 53% | stable compared with previous years |
Table: Artificial intelligence in Brazilian companies 5 data points
| Data point | Value | Comparison |
|---|---|---|
| Companies that use artificial intelligence applications | 17% | it was 13% in 2024 |
| Small companies that use artificial intelligence | 15% | it was 10% in 2024 |
| Large companies that use artificial intelligence | 50% | it was 38% in 2024 |
| Estimated total of companies that use artificial intelligence | 93,475 | |
| Companies that use AI and adopted ready-made solutions | 80% | it was 76% in 2024 |
Source: Cetic.br and NIC.br, TIC Empresas 2025, executive summary (in Portuguese). Data collected between February 2025 and January 2026, with 4,174 companies interviewed.
Small businesses: how they sell and advertise
Among small businesses, WhatsApp is the store, Instagram is the shop window and many owners run everything alone. Almost four in ten still do not invest anything in ads.
Table: Digital channels small businesses use to sell 4 data points
| Data point | Value | Comparison |
|---|---|---|
| Small businesses that sell through WhatsApp | 81% | |
| Small businesses that sell through Instagram | 60% | it overtook Facebook |
| Small businesses that sell through Facebook | 34% | it was 40% |
| Small businesses that have already paid for ads on social media | 48% | 59% among micro and small companies, 39% among individual microentrepreneurs (MEI) |
Source: Sebrae, 9th edition of the Pulso dos Pequenos Negócios survey (data collected from November 25 to December 17, 2024), as published by Agência Sebrae de Notícias (in Portuguese).
Table: Structure of small businesses that sell online 6 data points
| Data point | Value | Comparison |
|---|---|---|
| Surveyed small businesses that do not sell online yet | 32.07% | |
| E-commerce operations run by the owner alone | 58.45% | 34.45% have 2 to 5 people |
| Online sellers that do not sell on any marketplace | 71.50% | 22.01% sell on 1 or 2 |
| Online sellers that also have a physical store | 50.14% | 44.34% sell only online |
| Operations with an average order value of up to R$100 | 32% | 28% between R$100 and R$300 |
| Sellers that do not know their own repeat purchase rate | 22.50% |
Source: Sebrae and Fórum E-Commerce Brasil, Radar do Mercado Digital 2026 (in Portuguese), July 2026, with 3,081 companies responding. The percentages refer to those who answered each question.
Table: Online stores of small and medium-sized companies 5 data points
| Data point | Value | Comparison |
|---|---|---|
| Online stores run by a single person | 62% | |
| Store owners who name the low conversion rate as a problem | 57% | 51% mention low traffic |
| Store owners who use WhatsApp as an additional sales channel | 73% | the most used for the third year in a row |
| Store owners who already use artificial intelligence actively | 72% | |
| Store owners who also sell on marketplaces | 33% | Mercado Livre: 72% of them; Shopee: 65% |
Source: Nuvemshop, NuvemCommerce 2026 (in Portuguese), with data from store owners on the platform in 2025.
Google and SEO: searches, clicks and artificial intelligence
Almost nine in ten searches in Brazil happen on Google, and most of the clicks stay with the first three results. What is new is the AI summary at the top of the page, which reduces clicks and raises the value of being the cited source. That is why SEO consulting now also covers how a company shows up in AI answers.
Source: StatCounter Global Stats, all platforms, September 2026.
Table: How clicks are distributed across Google results 3 data points
| Data point | Value | Comparison |
|---|---|---|
| Click-through rate (CTR) of the first organic result | 27.6% | 10 times more likely to be clicked than the tenth |
| Clicks that go to the first three results | 54.4% | |
| People who click on any result on the second page | 0.63% |
Source: Backlinko, analysis of about 4 million search results, updated in April 2025. Global data.
Source: Ahrefs, February 2026, with 300,000 keywords, comparing December 2023 with December 2025. In the previous study, from April 2025, the drop for the first position was 34.5%. Global data.
Table: Behavior of people who see an AI summary on Google (United States) 4 data points
| Data point | Value | Comparison |
|---|---|---|
| Visits with a click on a traditional result when there is an AI summary | 8% | 15% when there is no summary |
| Visits with a click on a link inside the AI summary | 1% | |
| Google searches that showed an AI summary in March 2025 | 18% | |
| Visits in which the person ends the browsing session after seeing the AI summary | 26% | 16% with no summary |
Source: Pew Research Center, July 2025, with 900 US adults and 68,879 searches.
Table: Where Brazilian e-commerce traffic comes from 4 data points
| Data point | Value | Comparison |
|---|---|---|
| E-commerce traffic that comes from organic search | 27.5% | second largest source, behind direct access |
| E-commerce traffic that comes from paid search | 21.8% | |
| Visits to e-commerce websites and apps in 12 months | 33.6 billion | |
| E-commerce audience concentrated in the 10 largest stores | 57.8% | Mercado Livre: 16%; Shopee: 12.5%; Amazon: 9.7% |
Source: Conversion, Relatório Setores do E-commerce no Brasil (in Portuguese), January 2026 edition (data from December 2025, based on SimilarWeb). The traffic channels refer to desktop visits.
Table: Website speed and experience (Core Web Vitals) 4 data points
| Data point | Value | Comparison |
|---|---|---|
| Websites with good Core Web Vitals on mobile | 48% | 56% on desktop |
| Websites with a good loading time for the main content (LCP) on mobile | 62% | |
| Websites with a good response to interactions (INP) on mobile | 77% | |
| Pages with good visual stability (CLS) on mobile | 81% |
Source: HTTP Archive, Web Almanac 2025, with data from July 2025. Global data.
Online reviews: the weight of reputation
Before calling or asking for a quote, the customer reads what others have said. And the customer has become more demanding: a high rating, many reviews and recent reviews. The data below comes from consumers in the United States. It is not a Brazilian survey, and it is here as a reference for a behavior we also see in Brazil.
Table: How consumers use reviews of local businesses 9 data points
| Data point | Value | Comparison |
|---|---|---|
| Consumers who read reviews of local businesses | 97% | |
| Consumers who always read reviews when looking for a business | 41% | it was 29% the year before |
| Consumers who use Google to read reviews | 71% | it was 83% in 2025 |
| Consumers who use ChatGPT or another AI to ask for local recommendations | 45% | it was 6% the year before |
| Consumers who do not use a business with fewer than 20 reviews | 47% | |
| Consumers who only consider reviews from the last three months | 74% | |
| Consumers who only use businesses with 4.5 stars or more | 31% | it was 17% the year before |
| Consumers who expect the owner to reply to reviews | 89% | 80% prefer those who reply to all of them |
| Consumers who visit the business website after reading positive reviews | 54% |
Source: BrightLocal, Local Consumer Review Survey 2026. Survey with consumers in the United States.
Digital advertising: how much Brazil invests in ads
Investment in digital ads has grown 80% since 2020. More than half of the money goes to social media and a quarter to search. Anyone starting with paid ads management in Brazil needs to know the ground they are stepping on.
Table: Investment in digital advertising in Brazil in 2025 6 data points
| Data point | Value | Comparison |
|---|---|---|
| Investment in digital advertising in 2025 | R$42.7 billion | up 12.7% over 2024 |
| Accumulated growth of the investment since 2020 | 80% | |
| Investment in retail media | R$4.8 billion | up 37% in one year |
| Investment in digital out-of-home media (DOOH) | R$4.4 billion | first time in the study |
| Share of video in digital investment | 49% | |
| Share of retail in digital investment | 25% | the sector that invests the most |
Source: IAB Brasil and Kantar Ibope Media, Digital AdSpend 2026, as reported by Exame (in Portuguese), April 2026.
E-commerce: revenue, orders and conversion
E-commerce has grown for the eighth year in a row. The other side of the coin: of every 100 visits to a small online store, fewer than one becomes a sale. Traffic with no conversion is money standing still, and that is where the text and the structure of the page make the difference.
Table: Brazilian e-commerce: 2025 results and 2026 forecast 7 data points
| Data point | Value | Comparison |
|---|---|---|
| E-commerce revenue in 2025 | R$235.5 billion | up about 15.3% over 2024 |
| Online orders in 2025 | 438.9 million | |
| Average e-commerce order value in 2025 | R$536.60 | |
| Online shoppers in 2025 | 94.2 million | 60% are women |
| Revenue forecast for 2026 | R$259.8 billion | up 10.3% |
| Online shoppers forecast for 2026 | 97.06 million | |
| Online purchases made in the Southeast region | 55% | class C: 54% of shoppers |
Source: Abiacom (Brazilian association of artificial intelligence and e-commerce), as reported by Mercado e Consumo (in Portuguese), February 2026.
Table: Indicators of online stores of small and medium-sized companies 5 data points
| Data point | Value | Comparison |
|---|---|---|
| Average conversion rate of stores with revenue of up to R$100,000 a month | 0.75% | 1.17% in those above that |
| Average cart abandonment rate in stores with revenue of up to R$100,000 a month | 80% | 77% in those above that |
| Overall average order value of the stores | R$262 | up 6% over 2024 |
| Transactions paid with Pix | 49% | credit card: 45% |
| Store owners who do not have a physical store | 67% |
Source: Nuvemshop, NuvemCommerce 2026 (in Portuguese), with data from store owners on the platform in 2025.
Marketing and sales: targets, management and AI in companies
Almost every company wants to grow, but most miss the target. The numbers show why: they do not measure. More than a third of marketing teams work with no target, and more than half of the companies do not track funnel conversion.
Table: Marketing and sales targets and management in Brazilian companies 10 data points
| Data point | Value | Comparison |
|---|---|---|
| Marketing teams with a defined target that missed it in 2025 | 73% | |
| Marketing teams that work with no defined target | 37% | |
| Companies that missed the sales target in 2025 | 75% | 87% intend to grow more in 2026 |
| Companies with satisfactory integration between marketing and sales | 16% | |
| Companies that still operate with no CRM | 54% | |
| Companies that do not track funnel conversion rates | 62% | |
| Companies that depend on third-party platforms and channels | 82% | |
| Companies that use artificial intelligence in their operations | 59% | |
| Sales teams that use WhatsApp as the main first contact | 75% | |
| Marketing teams that intend to increase investment in 2026 | 36% | 45% will keep it and 19% will reduce it |
Source: RD Station, Panorama de Marketing e Vendas 2026, and Meio e Mensagem (both in Portuguese), May 2026.
What these numbers mean if you want to sell in Brazil
A number on its own does not pay the bills. These are the five readings we take from the set:
- Your Brazilian customer is online, and on a mobile phone. With 90.5% of the population connected and 98.7% of users going online on a phone, a website that works poorly on a small screen loses the sale before it starts.
- A good website still sets a company apart. Almost half of Brazilian companies do not have one. A fast, clear website in Portuguese shows up where many local competitors are missing.
- Plan for WhatsApp. Among companies that sell online, about eight in ten sell through messages, and 75% of sales teams use WhatsApp as the main first contact. A website with only a contact form leaves out the channel Brazilians use most to buy.
- Search in Brazil means Google, and AI answers changed the game. Google holds 88.41% of searches in the country, and in the global data the first three results take more than half of the clicks. With AI summaries, being the cited source matters as much as the position.
- Social ads are crowded, search less so. 55% of digital ad investment goes to social media and 26% to search. Among small businesses that sell online, 45.05% put most of their budget on Instagram and Facebook Ads, and only 8.31% on Google Ads.
Planning to reach Brazilian customers?
We are a Brazilian agency that builds websites and runs SEO and paid ads in Portuguese. Ask for a free assessment and get the points that matter most and where to start.
Frequently asked questions
How many Brazilians use the internet in 2026?
According to the IBGE survey PNAD Contínua TIC, released in July 2026, 168.7 million people aged 10 or older use the internet in Brazil, the equivalent of 90.5% of that population. The mobile phone is how 98.7% of users go online.
How many Brazilian companies have a website?
According to the TIC Empresas 2025 survey, by Cetic.br, 53% of Brazilian companies with more than ten employed people have a website. The number has been stable since 2019, when it was 54%. In the same period, presence on WhatsApp or Telegram reached 79% of companies.
What is the most used search engine in Brazil?
Google. In September 2026 it accounted for 88.41% of searches in Brazil, according to StatCounter. Bing comes second, with 9.63%, and Yahoo! third, with 1.54%.
How much does Brazil invest in digital advertising?
R$42.7 billion in 2025, up 12.7% over 2024, according to the Digital AdSpend 2026 study, by IAB Brasil with Kantar Ibope Media. Social media took 55% of the investment and search took 26%.
Can I use this data on my website, paper or presentation?
Yes. The numbers belong to the original surveys, so always cite the source of each data point. If this roundup helped you find the information, a link to this page is welcome. The copy button next to each row already brings the data point with its source.
Methodology and how to cite
This article brings together public data from 20 surveys and reports. We did not run our own survey: the work was to locate each number, check it in the original document or news report and organize it by topic.
- Only numbers we could read in the source indicated are included. What could not be checked was left out.
- Each table states the survey, the year and, when there is one, the group it covers (for example, companies with more than ten employed people).
- When the data is from another country or global, that is written in the source line.
- Different surveys measure different things. Avoid adding up or comparing percentages from different sources.
- Amounts are in Brazilian reais (R$), as published by each source, with no currency conversion.
- The date at the top shows the last review.
How to cite this article
Mr. Hermys. Digital marketing statistics in Brazil in 2026. Volta Redonda, Brazil, October 7, 2026. Available at: https://mrhermys.com/en/blog/digital-marketing-statistics-brazil/
Found an outdated number or have a survey to suggest? Write to hello@mrhermys.com.
Sources
Most of the original documents are in Portuguese.
- IBGE. PNAD Contínua TIC 2025. Released on July 2, 2026. Via Teletime.
- Cetic.br and NIC.br. TIC Domicílios 2025. Via Movimento Econômico.
- DataReportal. Digital 2026: Brazil. November 2025.
- Cetic.br and NIC.br. TIC Empresas 2025: executive summary. 2026.
- Sebrae. Pequenos negócios somam 24 milhões de empresas ativas. June 2026.
- Federal Government of Brazil. Mapa de Empresas, bulletin for the last four months of 2024. Via Fenacon.
- Registro.br. Domain statistics. As of September 27, 2026.
- Sebrae. Pulso dos Pequenos Negócios, 9th edition. Via Agência Sebrae de Notícias. February 2025.
- Sebrae and Fórum E-Commerce Brasil. Radar do Mercado Digital 2026. July 2026.
- Nuvemshop. NuvemCommerce 2026.
- StatCounter Global Stats. Search Engine Market Share Brazil. September 2026.
- Backlinko. Google CTR Stats. Updated in April 2025.
- Ahrefs. AI Overviews Reduce Clicks (update). February 2026.
- Pew Research Center. Google users are less likely to click on links when an AI summary appears in the results. July 2025.
- Conversion. Relatório Setores do E-commerce no Brasil. January 2026.
- HTTP Archive. Web Almanac 2025: Performance. January 2026.
- BrightLocal. Local Consumer Review Survey 2026.
- IAB Brasil and Kantar Ibope Media. Digital AdSpend 2026. Via Exame. April 2026.
- Abiacom. E-commerce results for 2025 and forecast for 2026. Via Mercado e Consumo. February 2026.
- RD Station. Panorama de Marketing e Vendas 2026. Also via Meio e Mensagem. May 2026.
Know someone who needs to read this?
Share it. If you use any data point, cite the original source and, if you can, this article.
Márcio Goulart
Founder of Mr. Hermys, a digital marketing agency from Volta Redonda, Brazil. Builds websites and handles SEO and paid ads, working 100% online.
Social media: where Brazilians are
Brazil had 150 million social media user identities in October 2025, the equivalent of 70.4% of the population. Instagram grew 8% in one year, TikTok grew 17.6% and Facebook shrank 1.3%.
Table: Internet and social media in Brazil, according to DataReportal 7 data points
Source: DataReportal, Digital 2026: Brazil, published in November 2025. The numbers for each platform are the potential ad reach and are not the same as unique people.